
RAMANMETRIX is a software solution for evaluating Raman spectroscopic data. Through the integration of machine-learning algorithms, it is particularly suitable for the analysis of extensive and complex data sets.
While RAMANMETRIX is primarily optimized for Raman spectroscopy, we have also achieved promising results with other spectroscopic techniques, such as NIR and NMR. We are eager to incorporate RAMANMETRIX for the analytical techniques you are employing as well.
The software provides reliable and robust data analysis with a convenient and simple user interface that allows easy navigation through all necessary data processing steps.
Customisable software interface
The software interface is customisable to the user's experience level, making simultaneous use possible for both inexperienced users, according to the 1-click process, and experienced users, who can use a wide range of tools for data processing.
Each individual step can be monitored through exportable overview plots in PNG and CSV format.
Data and metadata can be uploaded.
Raman spectral data can be standardised and various machine learning models, including Deep Learning, can be constructed for Raman spectroscopic data.
Classification models for identity determination and regression models for concentration determination can be constructed and then applied to unknown test data sets.
Advantages of RAMANMETRIX
RamanMetrix provides a standardised data processing pipeline that can be automated for process monitoring.
The advantages are:
Despiking tool for automated correction of spectra.
Additional stability through wavenumber and intensity calibration
Robust baseline correction
Choice of different normalisation methods
Quality check of spectra
Pre-trained models can also be used for online predictions with the API
RAMANMETRIX
Validation approaches
Validation approaches
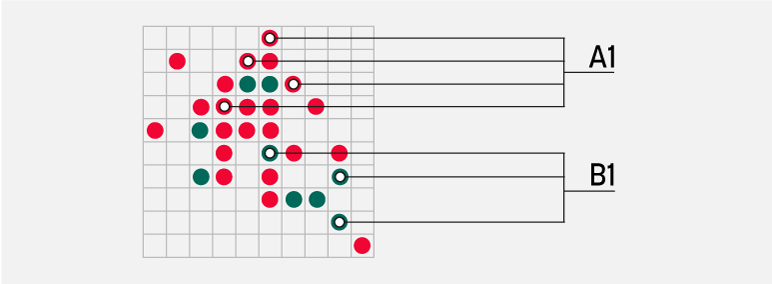
In the case of supervised models, their accuracy can be verified using two implemented cross-validation approaches:
Leave-One-Batch-Out cross-validation;
10-fold cross-validation.
Additional validation of the constructed model can be done by applying it to a labelled test data set or it can be used to predict an unlabelled test data set. In this case, test data and training data are processed in the same way and then the pre-constructed model is applied. Alternatively, the model and parameters can be exported and saved or sent to another user for further use.
When completed, the analysis data is displayed as a printable results report with clear information in the form of diagrams, a summary of the metadata and the prediction. In addition to the report, detailed results can be exported as csv files listing all pre-processed spectra, metadata tables and predictions for each spectrum.
Models included in the software
Models included in the software
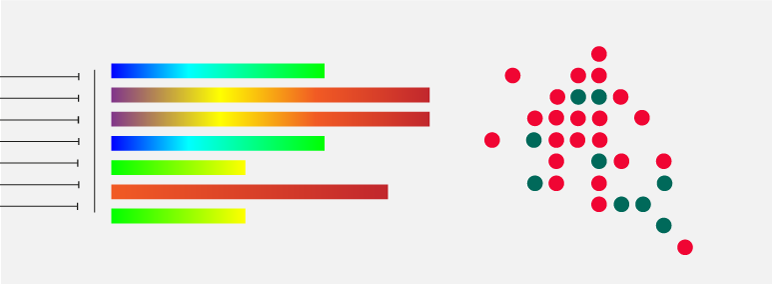
After the pre-processing steps and optional quality check, it is possible to construct either supervised or unsupervised machine learning models. To avoid overfitting the models, dimensionality reduction is performed using principal component analysis (PCA) or a convolutional neural network (CNN). Depending on whether an identification or concentration determination is to be carried out, a classification or regression model is required. The following models are available in the software for this purpose:
Linear Discriminant Analysis (LDA);
Random Forest (RF);
k-nearest neighbours (kNN);
support vector machine (SVM);
partial least squares discriminant analysis (PLS-DA);
unsupervised hierarchical Ward cluster analysis (HCA);
linear regression;
partial least squares regression (PLSR).
Pre-processing of the Raman spectra
Pre-processing of the Raman spectra
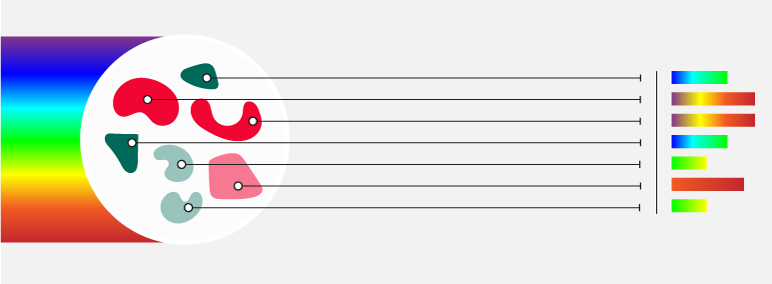
Raman spectra can be imported into the software in all common data formats, such as TXT, CSV, LPE or SPC files. In the first step after the data import, a number of different pre-processing steps are carried out to standardise the spectra. These include:
Cosmic ray peak correction;
Wavenumber calibration;
baseline correction;
spectral normalisation.
Advanced users have access to a wide range of manually adjustable pre-processing parameters and individual data quality filters. Here it is possible to set thresholds for the following values:
selected quality peaks (min and max);
correlation with the mean spectrum;
signal-to-noise ratio (min);
background intensity (max);
integrated intensity of baseline-corrected spectra (min and max).
Individual data processing steps can be monitored by recording the mean spectra at each step.
